Queen mating flights
Synopsis: How far does a queen fly to mate? Studies using RFID-tagged queens are providing insights into the frequency, duration and temperature dependence of queen mating flights … all of which have practical implications for beekeeping.
Introduction
Although it tends to be a rather poor topic of conversation at dinner parties {{1}}, I’m getting increasingly interested in the mating biology of honey bees. This is an essential part of the life cycle of our bees, and one that has been – and continues to be – well studied.
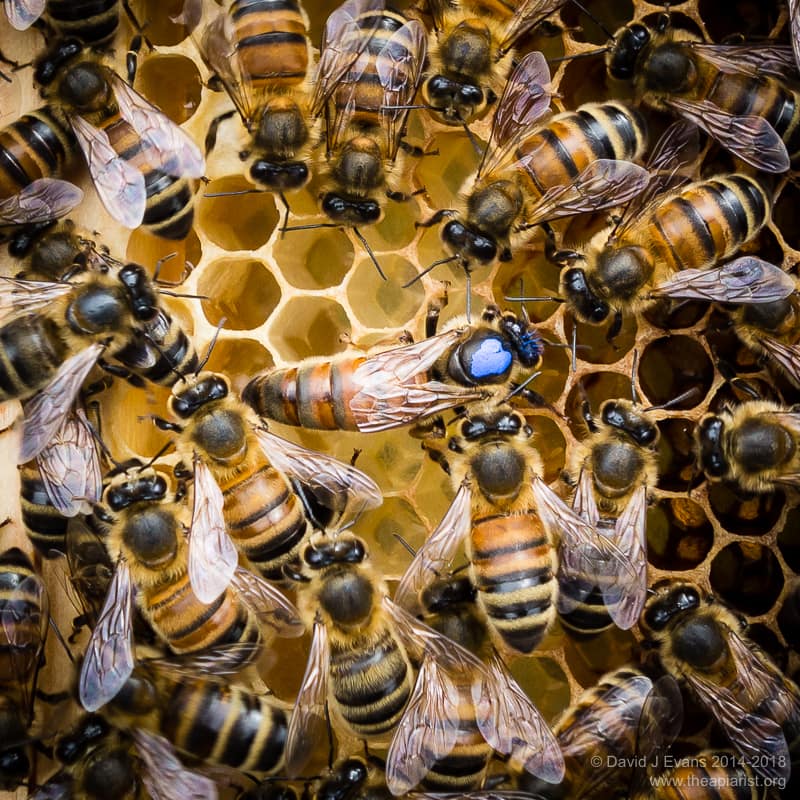
Here’s one I made earlier …
When I lived in the Midlands there were a seemingly endless supply of bees in the area. Beebase reported that there were about 200 other apiaries within 10 km of my main apiary. Assuming an average of 5 hives per apiary {{2}}, and ignoring any wild or feral colonies, that’s 1000 hives producing drones with which the queen could mate {{3}}.
Of course, it’s not quite that simple, but bear with me.
In Fife, on the east coast of Scotland, my apiaries are in areas with about 35-40 other apiaries within 10 km, so – using similarly dodgy maths – perhaps 200 hives.
Nevertheless, bees are in apparently plentiful supply.
What do I mean by ‘plentiful’?
As a beekeeper, the two main ways – other than Beebase or by physically searching for them – I can judge the numbers of bees in the environment are, the:
- success of my bait hives in attracting swarms {{4}}, and
- the ease with which my queens get mated
If I catch lots of swarms and a high percentage of my queens mate successfully then there must be a lot of bees about.
Apiary density
I was intending to start this post with a discussion of the evenness or otherwise of the distribution of apiaries within the Beebase-defined 10 km radius.
However, it turns out {{5}} that my maths are not good enough to plot a truly even distribution of hives/apiaries {{6}}. Anyway, common sense dictates that apiaries are not evenly distributed … so let’s instead just consider the number of hives per square kilometre within that Beebase 10 km boundary.
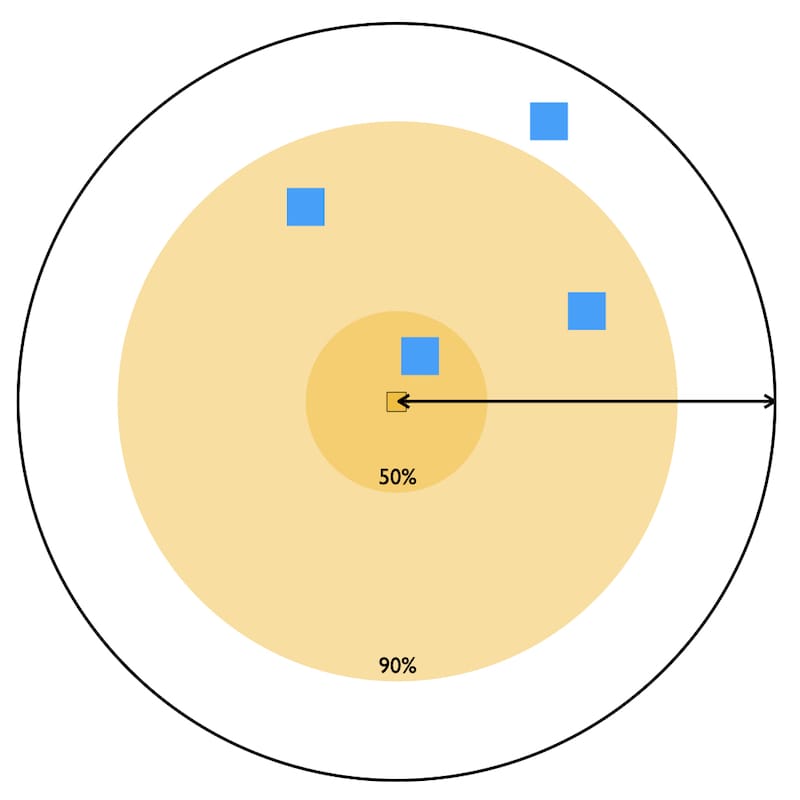
In the diagram above the enclosing black circle indicates the area within which Beebase reports ‘neighbouring’ (i.e. within 10 km) apiaries. Inside that I’ve shown just four of the 314 one km2 blocks (in blue). On average, in the Midlands each of these would contain ~3.2 managed hives {{7}}. In Fife, there would be – on average again – about 5 times fewer hives per blue square.
Several studies suggest that drones fly relatively short distances from the hive to the drone congregation areas (DCA) where they ‘loiter with intent’ (of finding a virgin queen to mate with). I’ve discussed the use of harmonic radar tracking studies to identify these locations.
So, how many of these hives are actually within the range of a queen on a mating flight?
Where do you go to my lovely?
I posed the question How many of these hives … ? as we don’t know where the actual DCAs are.
The radar mapping study identified several within a few hundred metres of three drone producing colonies, so it seems reasonable to simply assume the DCAs are near the hives, and we know the average density of these.
Harmonic radar tracking of tagged queens visiting DCAs was not successful. It’s a short range technique, and the queen is known to sometimes fly long distances to visit DCAs.
I’ve discussed some of the studies used to determine these long-distance virgin queen flights, but summarise them again here:
- In studies almost 90 years ago, Klatt observed successful mating on an isolated peninsula when the queen and drones were 6.3 miles (10.1 km) apart
- In the mid-50’s Peer {{8}} demonstrated matings could occur when the queen and drones were 10.1 miles (>16 km) apart
- Jensen {{9}} demonstrated mating when the queen and drones were 9.3 miles (15 km) apart
Of course, in all these studies it was not determined whether the queen and drones flew similar distances to the DCA. Since we know that drones probably fly relatively short distances it’s likely that the queen does the majority of the leg wing-work.
Ignore the outliers
The Peer studies showed that, although mating could occur when drones and queens were very widely separated, there was an inverse relationship between mating success and distance.
Just because 5% {{10}} of queens can mate following combined flight distances of 15 km does not mean that’s the distance they usually travel.
Actually, if only 5% of queens get mated at that distance then we can be pretty sure they usually fly much shorter distances.
Fortunately, Jensen did a more thorough analysis of this and showed that 90% of all matings occurred within 4.6 miles (7.4 km) and 50% within 1.5 miles (2.4 km).
And those are the 50% and 90% circles plotted on the diagram above, encompassing an area of 18 km2 and 174 km2 respectively.
Or, to express that area in potential drone donor colonies, 58 or 548 respectively in the Midlands, with a hive density of 3.2/km2 {{11}}.
So, in areas with reasonable densities of bees, knowing the majority of queens fly no more than 7.4 km, there are potentially hundreds of colonies producing drones that the queen could mate with.
All of which is a rambling introduction to looking at queen mating distances using a different approach.
Rather than work out how far she flies, what happens if we measure how long she takes?
If we know how fast the queen can fly we can again calculate distances and the number of potential drone producing colonies within range.
Time and weather dependence
But there are additional advantages of looking at queen mating flight duration.
If we can do it accurately we can also determine the:
- time of day when most mating flights take place,
- influence of the weather on the duration and frequency of queen mating flights,
- number of orientation and mating flights the queen takes.
And frankly, as a practical beekeeper, I’m much more interested in the first two of these than I am in the absolute distance she flies for her dalliances.
In an area well-populated with hives, understanding when the queen is likely to be away on a mating flight will help me avoid interrupting her return, and determining when she is likely to start laying.
But, as a scientist, I’m also really interested in the third point as there is some interesting recent work to suggest that drones try and restrict queens taking multiple mating flights {{12}}.
Heidinger et al., studied the mating behaviour of queens using radio frequency identification (RFID) tags {{13}}. Although the study produced no dramatically new results, it was a neat application of technology and allows me to discuss when mating flights occur and the influence of the weather in a little more detail.
The paper is Open Access if you’d like to read it. I’m not going to go through every subtle wrinkle and nuanced argument in the study, but will instead just focus on the important ’take home message(s)’.
RFID tagged queens
This is something I don’t need to discuss in anything other than cursory detail as I wrote about it three weeks ago in ’Chips with everything’.
Or perhaps I do? The post was only read by about 25% of the visitors who read the following week’s ’What they don’t tell you’ … it’s almost as though the hardcore science is less interesting than anecdotes about starting beekeeping. Surely not?
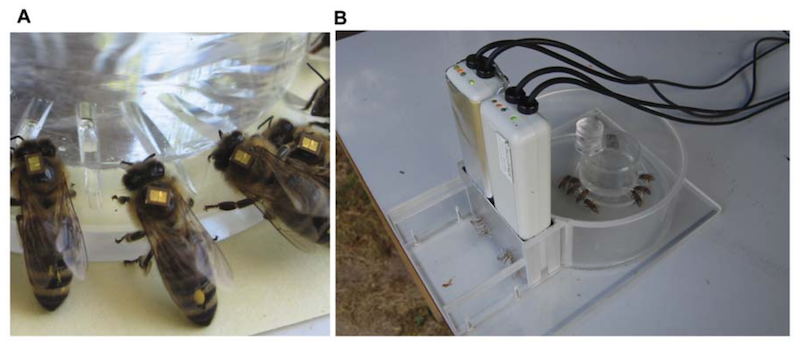
Essentially you stick a unique tag onto a bee and record when it enters or exits a hive using a sensitive reader at the hive entrance.
You don’t need to stand by the hive and watch anything.
All the ‘observations’ are made automagically and recorded digitally for subsequent analysis. You can therefore monitor hundreds of workers or dozens of queens simultaneously, thereby increasing the statistical robustness of the results obtained.
The Heidinger et al., study monitored the mating flights of 64 queens.
Of these, 11 were ‘missing in action’ {{14}} and never returned to the mating nuc.
Fifty three (83% … a figure very close to that quoted above from completely different studies) mated successfully and started laying eggs. However, two of these managed to get out and mate successfully without ever being detected by the RFID reader, meaning that flight times, frequencies and durations are from 51 queens {{15}}.
The study was conducted in two apiaries about 4 km apart in Middle-Thuringia, Germany, in June/July.
Logistics and data wrangling
Conducting these types of field studies is not straightforward. Queens have to be produced in batches and then introduced to mating nucs.
A week of bad weather means the queens will have aged before they have a chance to fly.
What do you do about queens that return from a mating flight but that cluster underneath the mating nuc, only entering (and triggering the reader) after an hour or two?
To accommodate these vagaries the authors:
- grouped queens according to age,
- considered flights less than 3 minutes long as orientation flights
- ignored mating flights of longer than one hour
And whatever filtered through from that pre-screening was then subjected to rigorous statistical analysis.
Time and duration of mating flights
Queens went on mating flights for 1 to 5 days, with an average of 2.2 +/- 0.98 day {{16}}. In easier-to-comprehend terms this means that about 70% of all the queens went on mating flights on 1 to 3 days.
Since it’s often quoted that queens leave the hive ‘once to mate’ this might be a surprise to some.
Perhaps even more surprising is that queens went on a total of 1 to 16 mating flights, with an average of 5.04 +/- 3.11.
One particularly enthusiastic queen went on 7 mating flights in one day. The very definition of ’hot to trot’.
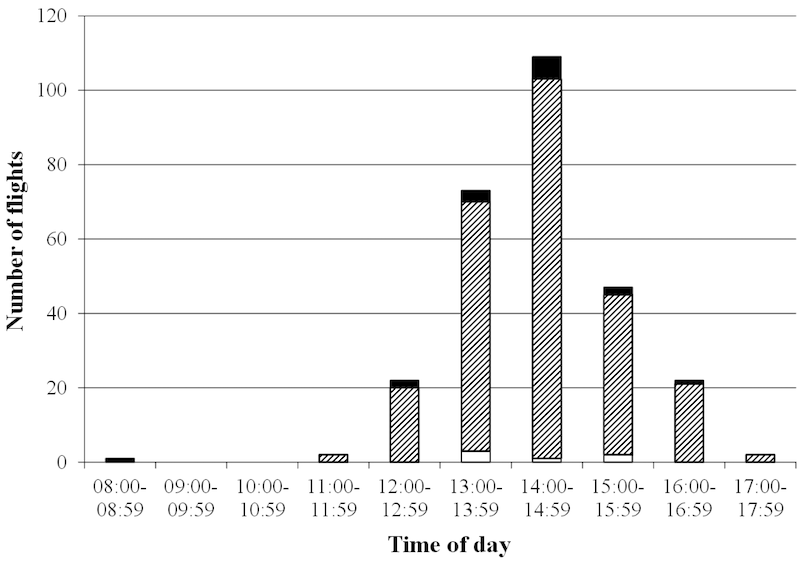
Over 80% of these mating flights took place between 1pm and 4pm. From a practical beekeeping standpoint, by avoiding this period for hive inspections you will significantly reduce the chances of being in the way when a queen returns to a mating nuc.
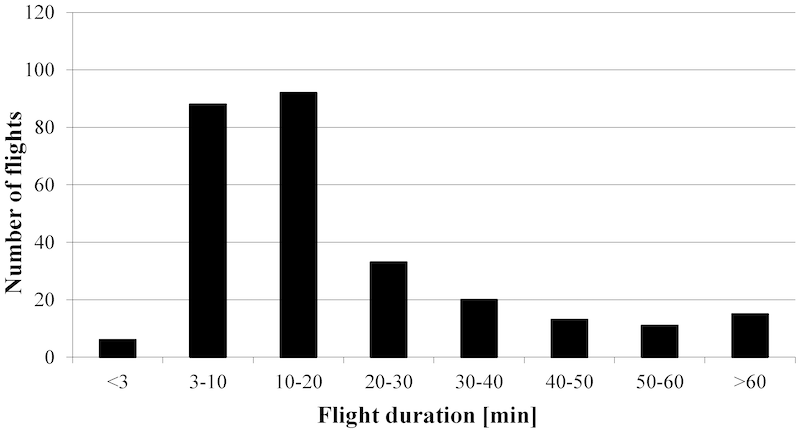
The average length of a mating flight was a bit less than 18 (17.69 +/- 13.19) minutes. Of approximately 255 mating flights (i.e. flights of 3-60 minutes duration) monitored, about 180 (70%) were of 20 minutes or less.
All of these results are in pretty good agreement with a wealth of literature collected using different methods over the last few decades.
Can we use some of these figures to calculate queen mating flight distance?
Duration x speed = distance
I can find nothing in the literature on the speed at which a queen flies. However, I do know that the escapee virgin queens I try and catch usually fly just too fast 🙁
Let’s assume for the sake of argument that the queen flies at about the same speed as a worker bee. This is usually reported as 25 km/hr unladen and about 17 km/hr when laden with pollen or nectar.
Therefore, a queen mating flight of 20 minutes at 25 km/hr involves flying a total distance of no more than 8.3 km. A 10 minute mating flight at 17 km/hr equates to 2.8 km.
These distances include three components, an inward and outward leg separated by the flight time within the DCA. Your guess is as good as mine as to how long the latter takes {{17}}.
However, not knowing something is the perfect opportunity for some informed speculation (or, as here {{18}}, wild guesswork).
Wildly uninformed guesswork
The queen mates with several drones while in the DCA. Although each mating takes a very short time (seconds) there is competition between the drones while they chase the queen, so she must stay within the DCA for a reasonable period.
Time for another assumption … this time let’s assume that the queen spends one third of the duration of her mating flight within the DCA or 4 minutes, whichever is the shorter {{19}}.
If that were the case, a 10 minute mating flight at 17 km/hr, with a third of the flight time being spent in the DCA, would mean the mating site was just 940 metres from the hive. Conversely, if the queen spent no more than 4 minutes in the DCA during a 20 minute mating flight at 25 km/hr, then the mating site must be 3.33 km from the hive.
Either my guessestimate for the time spent in the DCA is too high (quite possible), or the predicted flight speed of the queen is too low (unlikely to be wildly wrong, she’s not going to rush there at 75 km/hr) … or the typical distances queens travel to a DCA are significantly less than those measured using isolated queen and drone-producing colonies in the studies cited earlier by Jensen, Peer or Klatt (see above).
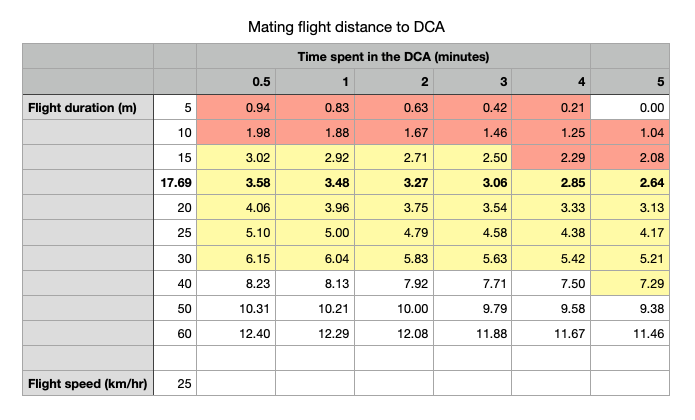
Relationship of time spent in DCA and potential maximum mating flight distance
The table above shows why I think queens likely spend less than 4 minutes in the DCA. Distances in red are within 2.4 km that Jensen showed 50% of matings occur in, those in yellow are within the 7.4 km that 90% of matings occured in {{20}}.
The influence of the apiary
Let’s stop all this wild guesswork and return to the calming certainties of statistically compelling data 😉
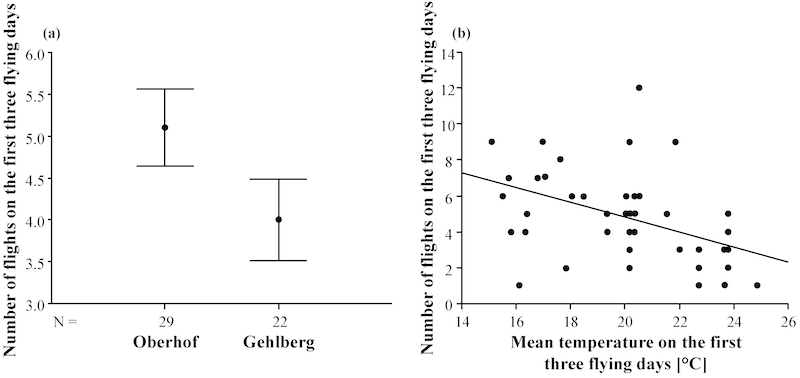
The Heidinger study involved two apiaries separated by a few kilometres. All the data discussed above uses recordings pooled from both apiaries. However, queens in one apiary went on more mating flights than in the other. The difference isn’t huge (5 vs. 4 flights in the first three flight days), but is statistically significant.
The queens are described as ‘sister queens’ and I assume this means they are all reared from larvae from the same mother queen, though this isn’t made explicit. If that is the case, it suggests the geography of the area influences queen mating flight frequency.
I say geography, rather than drone availability, as they also added an additional 47 (!) drone producing colonies near one apiary and observed no influence on queen mating flight characteristics.
Although the number of mating flights the queens went on differed, the duration of the flights did not.
The data start to get a bit more complicated when they considered the age of the queens and the duration of the first, second, third etc. flight … so I’ll skip all that and finally just consider the influence of temperature on mating flights.
Some like it hot
It is regularly stated that virgin queens need calm, sunny afternoons with a temperature exceeding 20°C before embarking on mating flights.
This is somewhat disconcerting for a beekeeper living on the cool/wet/windy – but exceeding beautiful – extremities of the UK.
In fact, mating flights – by which I mean flights of 3-60 minutes (as no record of successful mating on individual flights was made) – occurred in the Heidinger study between a range of 14°C and 25°C.
In cooler weather, queens tended to take more mating flights (shown in the right hand panel on the graph above). The line is a ‘best fit’ and it’s clear there is quite a bit of variation. However, at 15°C the queens would take about 7 flights, compared to only about 4 flights at 24°C {{21}}.
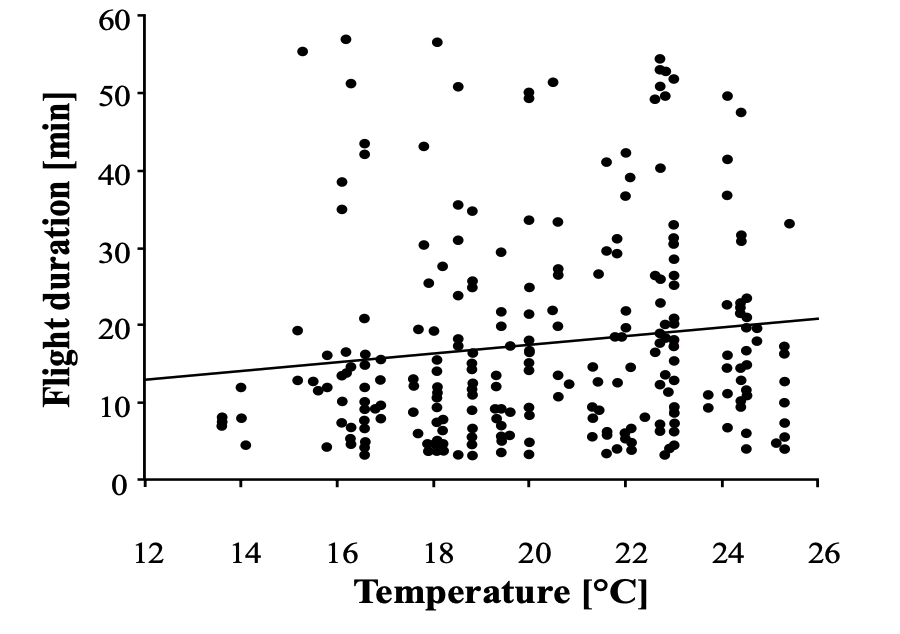
Unsurprisingly therefore, individual mating flights were of greater duration during warmer weather. Again the ‘best fit’ line is shown together with the variation in the primary data.
I found these last two graphs quite reassuring … there were lots of flights below 20°C.
Geek alert
I’m starting to get a bit obsessed with the weather here on the west coast and installed a weather station last summer. I only have complete records from July, but know we had a total of only 27 days on which the temperature exceeded 20°C from July and September.
2021 was an outstanding summer here on the west coast.
Next year I’ll have data for the full queen rearing season so hope to understand this aspect of the mating biology of my queens a little better.
Conclusions
I’ve covered a lot of ground in this post … from the how far can she fly to mate? studies of the 1930’s to what appear to be short duration, and therefore relatively local, mating flights of RFID-tagged bees.
Understanding when a queen is likely to go on a mating flight should help you with timing your colony inspections. It should certainly help curb your impatience as you wait for your queens to get mated.
Finally, knowing that she can fly on much cooler days than the widely-cited 20°C gives those of us living in more northerly latitudes some reassurance that our queen rearing efforts are not entirely futile.
Notes
Some figures I meant to quote earlier; if the queen only flies between 940 m and 3.33 km to the DCA (see Duration x speed= distance above), and assuming colony densities of either 0.6/km2 or 3.2/km2 (see Apiary density about 3000 words ago 🙁 ) the number of hives ‘within mating flight range’ are between 1.7 and 111.
Quite a range, so ample opportunity for good numbers of genetically diverse drones, though remember that apiaries are not evenly distributed and DCA’s are variable distances from drone producing colonies.
Treat all of my numbers (and particularly my calculations) with considerable caution.
{{1}}: At least at dull dinner parties when there aren’t other beekeepers present.
{{2}}: Which seems reasonable to me, but I’m happy to be persuaded otherwise if you have better information.
{{3}}: I’m going to discuss queen mating flight distances below … it can be further than you (or at least I) think.
{{4}}: OK, I acknowledge that this is related to the competence of the local beekeepers, but let’s ignore this to avoid causing any offence.
{{5}}: In what was precisely no surprise to me whatsoever.
{{6}}: For those who want to bamboozle themselves I suggest you read up on the Sunflower Seed Arrangement using a browser other than Chrome, which didn’t work for me on a Mac. Safari did work.
{{7}}: Ignoring, for convenience, the fact that Beebase underrepresents the number of hives in most areas as a significant proportion of beekeepers do not register their apiaries with the National Bee Unit. Come on! Get with the programme!
{{8}}: Peer DF & Farrar CL (1956) The mating range of the honey bee. Journal of Economic Entomology 49: 254–256 and Peer DF (1957) Further Studies on the Mating Range of the Honey Bee, Apis mellifera. The Canadian Entomologist 89:108-110.
{{9}}: Jensen AB et al., (2005) Quantifying honey bee mating range and isolation in semi-isolated valleys by DNA microsatellite paternity analysis. Conservation genetics 6:527-537.
{{10}}: Or whatever … remember that the usual figure quoted for queen mating success rates is about 80%.
{{11}}: And, for those interested in the Kingdom of Fife (and why wouldn’t you be? It’s lovely) 11.5 and 110 colonies respectively.
{{12}}: I’m going to discuss this in a week or three … this post ‘sets the scene’.
{{13}}: Heidinger, I.M.M.; Meixner, M.D.; Berg, S.; Büchler, R. Observation of the Mating Behavior of Honey Bee (Apis mellifera L.) Queens Using Radio-Frequency Identification (RFID): Factors Influencing the Duration and Frequency of Nuptial Flights. Insects 2014, 5, 513-527. https://doi.org/10.3390/insects5030513
{{14}}: Perhaps literally.
{{15}}: This shows the limitations of the technology. RFID readers for low-power or unpowered tags are only effective over a rather short range. Presumably these queens somehow bypassed the reader when leaving and returning as they checked that the tag was still attached to the laying queen.
{{16}}: For the uninitiated, the +/- 0.98 is the standard deviation, which is a measure of the variation of the difference from this average. What this means is that the average number of mating flights was 2.2, and that 68% of the sample were within the range 1.22 to 3.18 (i.e 2.2 minus or plus 0.98) days of mating flights.
{{17}}: Actually, I wouldn’t be at all surprised if it wasn’t a lot better than mine.
{{18}}: … and a whole lot more fun.
{{19}}: I told you there was going to be some wild guesswork … actually, I strongly suspect that the queen spends less than 4 minutes in the DCA.
{{20}}: And it’s worth emphasising here that Jensen used microsatellite analysis to ‘map’ matings, so a totally different method altogether.
{{21}}: These are average maximum temperatures and cumulative flights over three days.


Join the discussion ...